Failure to reestablish an effective World Trade Organization (WTO) dispute settlement procedure, stop the erosion of multilateral rules and end the China–US trade war causes capitals to rethink trade policy. One response is to redouble efforts to strike trade agreements with major trading partners. Already countries accounting for about 78% of world Gross Domestic Product (GDP) are members of mega-regional agreements, and based on our computations, preferential trade agreements (PTAs) will soon cover about two-thirds of world trade. Can PTAs replace a fading WTO or mitigate its effects? Amid deepening geopolitical rifts, how will trade relations among China, the EU, and the US, each a hegemon in their respective regions, evolve, and what will be the impact on smaller economies? In short, how will a trading system based increasingly on PTAs and weak multilateral rules look, and how will nations adapt? Absent reforms, the trading system is likely to fragment progressively into regional blocks organized around the hegemons. Trade within the regional blocks, mainly conducted under a mega-regional agreement, will likely remain quite open and predictable, but without strict multilateral rules and where PTAs are absent (as they are among the hegemons), interregional trade relations will become increasingly uncertain and unstable.
This is an Open Access article, distributed under the terms of the Creative Commons Attribution licence (http://creativecommons.org/licenses/by/4.0/), which permits unrestricted re-use, distribution and reproduction, provided the original article is properly cited.
Copyright © The Author(s), 2023. Published by Cambridge University Press on behalf of The World Trade Organization
The World Trade Organization (WTO) struggles to make substantial progress on trade reforms, its Appellate Body Footnote 1 has been disabled, and multilateral trade rules are eroding. There are at least 20 unresolved WTO disputes that remain in limbo, and that could be ‘Appealed into the void’. Footnote 2 Most recently, the US has announced export controls on high-end semiconductors to China, explicitly citing the need to ‘degrade’ China's technological capacity. The US also recently announced subsidies on electric vehicles made in the US, a clear violation of WTO rules, and rejected WTO panel findings against its invocation of national security to apply aluminum and steel tariffs on its allies. Of course, the US is not the only culprit in this worrisome dynamic. However, it is difficult to see how the rules-based system resists the barrage of rule-breaking, especially when the US, the architect of the present system, is in an ongoing and intensifying trade war with China, the world's largest exporter of goods.
Meanwhile, preferential trade agreements (PTAs) continue to proliferate. Trade under preferences (preferentialism) was envisaged initially as an exception to the most favored nation (MFN) principle at the General Agreement on Tariffs and Trade (GATT)/WTO. Still, WTO members now carry out most of their trade under some form of preferential agreement.
To be clear, this does not mean that most of the world goods trade benefits from preferences. Underscoring the WTO acquis, estimates placed the average trade-weighted preference margin at only 1% in 2008 (WTO, 2011). However, WTO MFN treatment can no longer be considered the assured counterfactual, and the expected welfare added by PTAs increases the lower the probability that WTO treatment remains.
The progressive erosion of WTO rules calls for capitals to reassess the role of PTAs in their trade policy. This article reviews the state of PTAs and addresses their systemic implications in the present context based on the most recent trends. At a time of fraught relations among the trade giants, China, the EU and the US, we pay special attention to the blocs forming around them. Can PTAs replace a fading WTO or at least mitigate the effects it has? How will a trading system based increasingly on PTAs and weak multilateral rules look, and how will nations adapt?
Drawing on updated information on the evolution of PTAs, we make the following assessments:
In the rest of this article, we provide information on the coverage and scope of PTAs, drawing on the latest available data in Section 2. We then discuss some systemic implications of the recent trends in Section 3. In Section 4, we offer some policy observations and conclude.
Before multilateral trade rules were adopted by 30 signatories of the General Agreement on Tariffs and Trade (GATT) in 1948 – global rules as we know them did not exist. In the eighteenth and nineteenth centuries, right up to World War 2, London and Paris proclaimed tariffs that applied generally, or only to some, and established imperial preferences, trade rules, and navigation laws that their colonies observed. Great and minor powers struck dozens of commercial treaties or fought trade wars. By today's standards, trade flows were small as a share of output – the commercial treaties of the past were shallow agreements, covering mainly tariffs, quotas, and navigation rights. Dating back to the eighteenth century, an MFN clause was often included. The MFN clause was an invention of commercial treaties of past centuries, the precursor of today's PTA, but it now lies at the core of multilateral trade disciplines. Underscoring the remarkable achievement of the post-war trading system under the GATT/WTO, the MFN clause and its companion, national treatment, now covers 164 countries or territories and 98% of world trade.
Over a long spell following the GATT's establishment, the contracting parties’ focus was on multilateral agreements that reduced tariffs and established global rules, culminating in the creation of the WTO and the expansion of its membership to cover nearly all of the world trade. Over eight GATT Rounds from 1948 to 1994, including the Uruguay Round, which launched the WTO, tariffs were reduced progressively. Since 1990, the world average MFN applied tariffs were cut from over 20% to under 10%, and below 5% in high-income countries. Footnote 3
The rise or, more accurately, the rebirth of preferentialism was a gradual process, one which overlapped with the multilateral trade agenda but eventually came to surpass it as the main preoccupation of WTO members. Today WTO members have some type of PTA – including non-reciprocal arrangements – with an average of 55 partners. Footnote 4 For example, each EU member has reciprocal agreements with 46 non-EU countries, in addition to those with the 26 other EU members, for a total of 72, while the US counts only 19 such reciprocal agreements, and China 37 of which eight are non-reciprocal.
The political economy literature identifies numerous possible motives behind PTAs (Whalley, Reference Whalley 1998). Footnote 5 Most relevant to the questions that this article seeks to address are four reasons countries pursue PTAs, each of which is likely to reinforce the present proliferation trend: the cementing of alliances, deep integration, trade policy uncertainty, and competitive liberalization.
Geopolitics has long been recognized as a driver of PTAs. For example, Eichengreen, Mehl, and Chitu ( Reference Eichengreen, Mehl and Chitu 2021) find, using the pre-World War 1 period as a reference, that defense pacts boost the probability of a bilateral trade agreement by as much as 20%. Other scholars have found a link between trade flows and military alliances (Long and Leeds, Reference Long and Leeds 2006). Of course, the EU is, at its origin, an agreement to cement peace between France and Germany, and all US trade agreements are with allies or closely aligned nations. At a time of increasing great power competition, trade deals motivated by alliances and national security will be pursued.
Also relevant to our purpose is that reciprocal PTAs are often more ambitious in scope than WTO disciplines. This feature makes them more attractive as globalization continues to advance (Dadush, Reference Dadush 2022). For example, they typically bind tariffs at zero for 90% or more of tariff lines, whereas WTO agreements allow tariffs to be bound at higher levels. They are also increasingly designed to address regulations that impede exchange. This ‘deep integration’ aims to ease the efficient allocation of all resources – capital, labor, and technologies – among the parties. The European Union's single market framework is the most advanced (and quite unique) example of this model.
Increased trade policy uncertainty, especially global uncertainty, associated with eroding multilateral rules and rifts among the world's largest trading nations, encourages countries to cement their most important trading relationships (Constantinescu, Mattoo, and Ruta, Reference Constantinescu, Mattoo and Ruta 2019; Handley and Limão, Reference Handley and Limão 2022). Meanwhile, the fear of exclusion, or loss of competitiveness, causes third parties to seek similar deals (Feinberg, Reference Feinberg 2003).
Our brief account of how PTAs rose (or returned) after a brief interlude of dominant multilateralism is divided into three periods. The first period, 1948 to 2010, ended with the global financial crisis and saw the most rapid advance in PTAs. The second period, from 2011 to 2020, saw a slower advance of trade coverage of PTAs but also a number of changes that, in our view, made them more systemically important. The third period, 2021 onwards, is a forward look based on the latest available data and our reading of the trends.
In describing the evolution of PTAs, we adapt the typology of Frankel, Stein, and Wei ( Reference Frankel, Stein and Wei 1997), recognizing four main types of agreements: non-reciprocated preferential trade agreements (NR-PTA); free trade agreement (FTA) – a reciprocated granting of preferences compliant with Article 24 conditions; partial free trade agreement (PFTA) – a reciprocated granting of preferences on a part of trade, such as those developing countries grant each other under the Enabling Clause; and a common market (CM) which includes customs unions, agreements which include adoption of a common external tariff, and even deeper agreements which may include free movement of capital and labor, adoption of a common currency, etc. CMs are the deepest type of agreement, followed by FTAs, PFTAs, and NR-PTAs, which are granted and can be withdrawn unilaterally.
The first trade agreement in the GATT-WTO era was the Southern Africa Customs Union (SACU) which entered into force in 1949, became inactive in 1955, and was relaunched in 1970. SACU is the post-war world's first customs union. Footnote 6 The European Customs Union, among six founding members, was launched in 1968, almost 20 years after SACU. Until it signed its first FTA with Israel in 1985, followed by the FTA with Canada in 1988, the United States focused its efforts almost exclusively on furthering the multilateral liberalization agenda in the GATT, which was the main driver, and with considerable success.
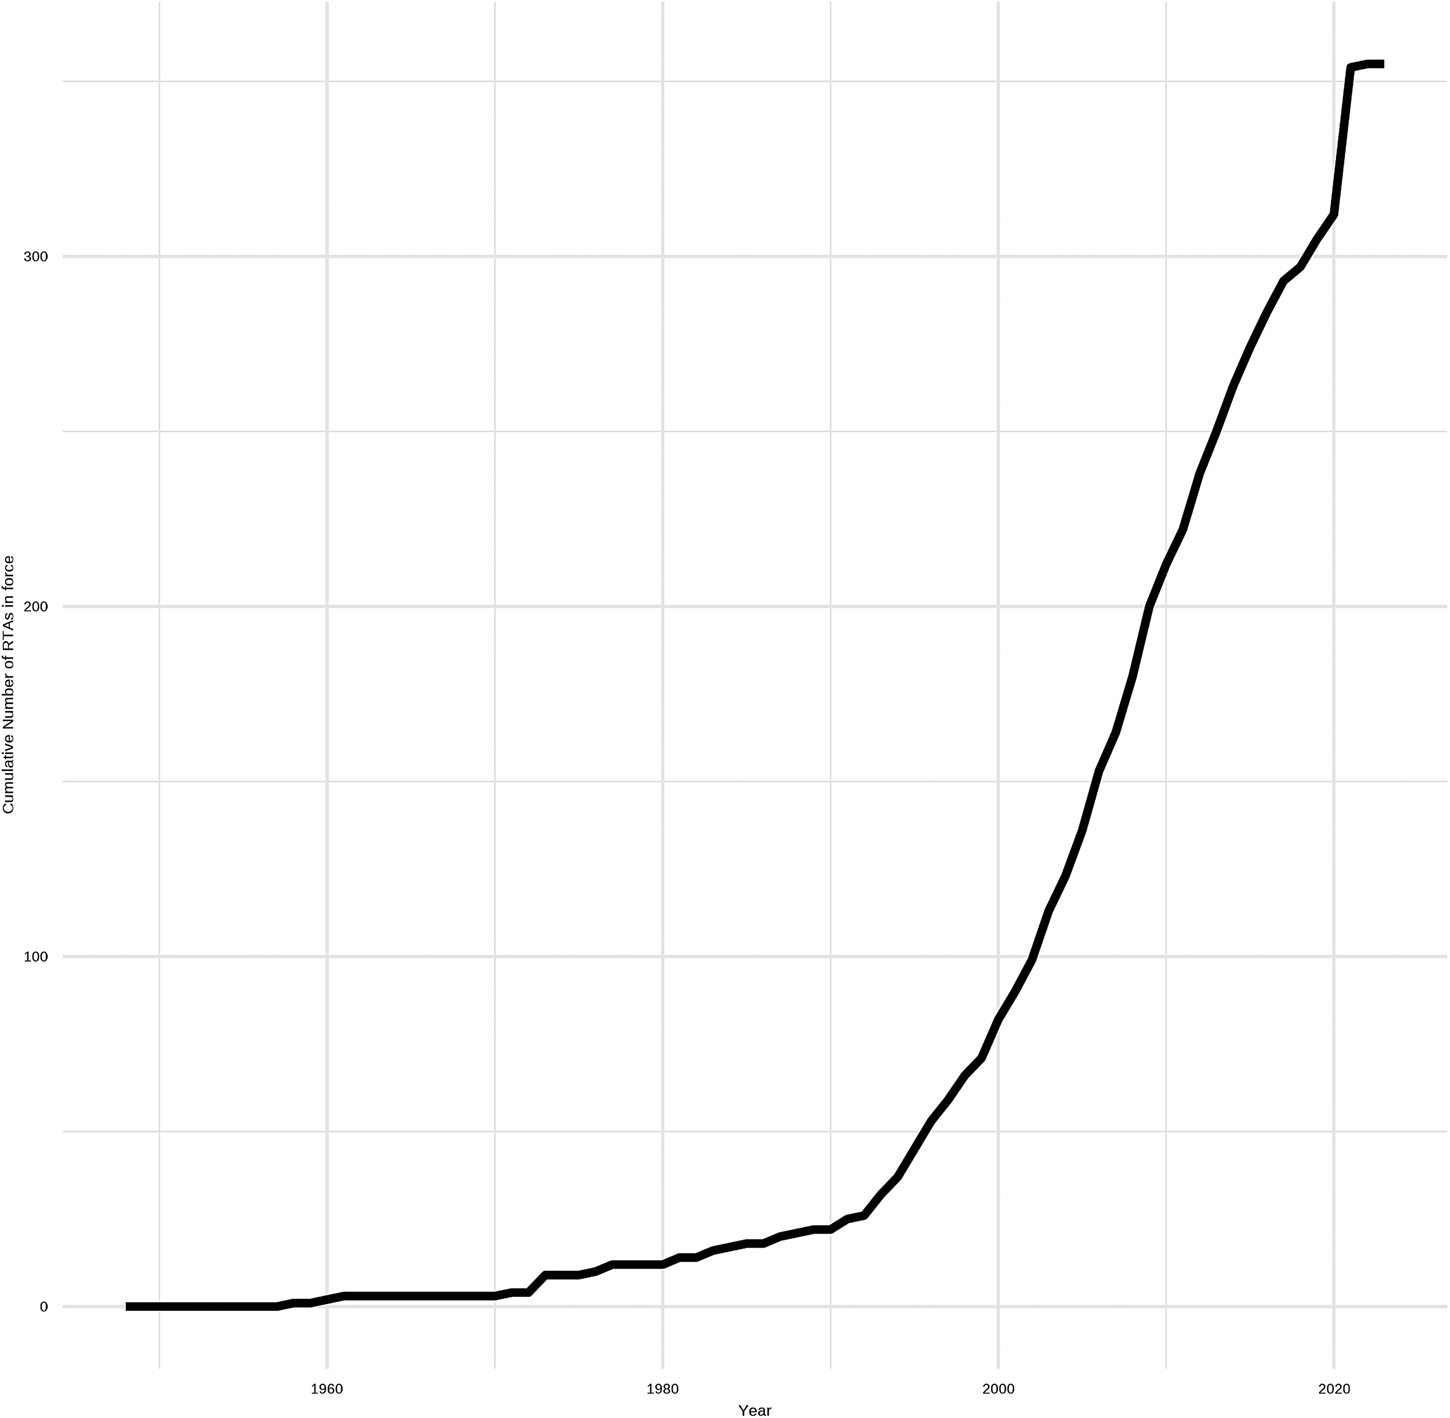
Despite progress in reducing tariffs multilaterally, the trend towards PTAs gradually gathered strength. As Figure 1 shows, a sharp acceleration in the number of agreements notified to the WTO occurred around 1991, shortly after the fall of the Berlin Wall and the entry of formerly planned economies into the mainstream of world trade. The rapid increase in the number of agreements persists to this day. Recently, the increase is due to Brexit and new agreements negotiated by the UK, Footnote 7 which replace EU agreements, with third parties and add little to world trade coverage of PTAs.
Figure 1. Evolution of Preferential Trade Agreements
As the UK case illustrates, counting notifications to the WTO is not terribly meaningful since agreements come in various sizes and may not be additional at all in terms of trade coverage. In 1965, with the European Community recently established, the share of world exports covered by preferential trade was 22%. By 2010, it was 60% (Limão, Reference Limão 2016). The most consequential PTAs include the progressive expansion of the European Union from six to 28 members and the conclusion of the North American Free Trade Agreement between Canada, Mexico, and the United States in 1994.
To update the estimates of trade covered by PTAs, we first tried to replicate the calculations to 2010, using Limao's method, drawing on the WTO as well as on the NSF-Kellogg Institute Database on Economic Integration Agreements. Footnote 8
That database uses the above-mentioned taxonomy of PTAs between 195 countries for the period 1950–2017. Footnote 9 This NSF-Kellogg database has been used in other subsequent studies (Nguyen and Vaubourg, Reference Nguyen and Vaubourg 2021; Díaz-Mora, García-López, and González-Díaz, Reference Díaz-Mora, García-López and González-Díaz 2022)
We arrive at 61.7% of exports covered by PTAs in 2010, 1.7 percentage points more than that of Limão ( Reference Limão 2016). Possible explanations for the small difference are data revisions that caused us to include an agreement not previously reported or caused us to use a different base for world trade. Footnote 10
As discussed, not all trade among the parties of a PTA is covered by the agreement. It is not possible to know exactly how much trade is covered without examining in depth the stipulations of hundreds of agreements. To get around this problem, we adopt the convention of counting all trade among the parties to the agreement whether the agreement covers it or not. Footnote 11
In the years following the GFC, trade negotiations lost momentum and only some small agreements were concluded, such as Chile–Viet Nam in 2011 and Australia–Japan in 2014. The conclusion of large preferential agreements occurred only in recent years.
To update the trade coverage analysis after 2010, we used the NSF-Kellogg database, available only to 2016. To compile the list of agreements that came into force after 2016, the primary source is the WTO, whose information ends in 2020. In Table 1, we show only agreements which cover more than 0.1% of world trade, reported to the WTO and signed between 2011 and 2020. We checked our estimates of trade coverage using the DESTA dataset, which provides data on all trade agreements signed since 1945. Footnote 12
Table 1. Larger Agreements signed 2011–2020 and In Force, Reported under Article XXIV
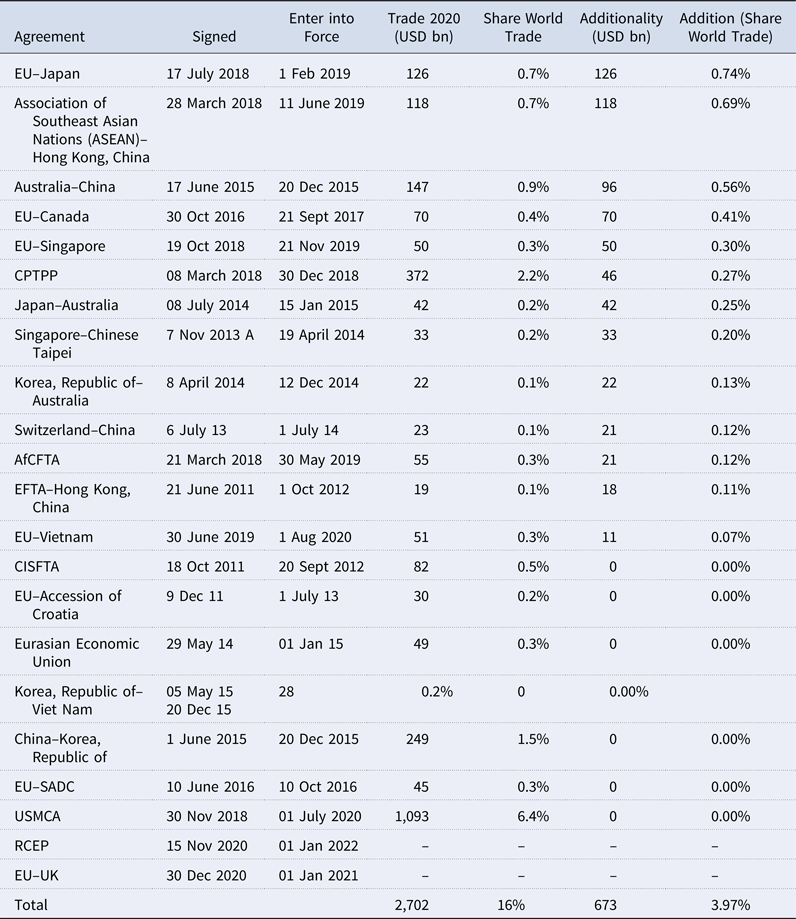
Source: Own Elaboration based on UN COMTRADE, Kellogg Institute, and WTO.
Note: In Commonwealth of Independent States Free Trade Area (CISFTA), the Eurasian Economic Union (EAEU), and EU-Southern African Development Community (SADC) it is hard to assess the exact amount of additionality due to previous agreements. We assume 0 to not overestimate additionality. In the case of the UK, we only mention in this table EU–UK, but every agreement signed by the UK in 2020 does not provide additionality. For African Continental Free Trade Area (AfCFTA), it should be noticed that not every country (11 out of 54) has deposited its instruments of ratification. Since we take Limão's estimations as the last accurate estimation of trade covered by PTA's, we do not update trade coverage before 2010.
Some trade agreements supersede previous ones among the parties, while other agreements – the mega-regionals – provide an additional layer to previously existing agreements among some parties. To account for the impact on world trade, we include a measure of additional trade covered by each agreement, which we refer to as additionality. For example, the additionality of USMCA is zero, that of Comprehensive and Progressive Agreement for Trans-Pacific Partnership (CPTPP) is partial, and that of EU–Japan is 100%. Of course, this is just a rough metric of impact since new agreements can differ materially from previous ones, deepening them (e.g., CPTPP) or diluting them (e.g., the UK's agreements following Brexit, including the EU–UK).
The RCEP and the EU–UK were signed in 2020 – so they are included in Table 1 – but entered into force in 2021 and 2022 respectively, so they did not provide additionality in 2020.
As Table 1 shows, the exports covered by Agreements reported to the WTO under Article XXIV for 2011–2020 represent 16% of the world total, of which almost 4% was additional. Not shown in Table 1 is the loss of GSP treatment; most notably, China's loss of GSP treatment by the EU reported to the WTO under the enabling clause. Footnote 13
Accounting for the latter, the coverage of PTAs of all kinds has increased by 2 percentage points since 2010, reaching 63.7% of world exports, with reciprocal agreements playing an increasingly important role and unilateral preferences a lesser one.
Ten Agreements explain 93% of the additionality in Table 1. Strikingly, eight of these were among Asian countries or involved an Asian country. EU–Canada and AfCFTA are the only two agreements among the top 8 ranked by additionality that do not include an Asian country as a partner.
In this sense, Asia has been the motor of additionality in trade agreements since the GFC. Two large agreements between Asian countries and the EU (EU–Japan, and EU–Singapore), also came into force. In contrast, the US struck no new agreements other than the renegotiation of NAFTA. The FTA between the US and Korea, which entered into force in 2012, providing additionality of around 0.7% of world exports, was signed in 2007.
Beyond expanding trade coverage, PTAs since 2010 have been of higher quality since the share of world exports covered by FTAs increased sharply. FTAs cover more trade and entail larger tariff reductions than either NR-PTAs or PFTAs. Whereas unilateral preferences can be subject to many conditions (for example on democracy and human rights) and can be withdrawn, FTAs constitute binding international treaties. As can be seen from Table 2, the share of world exports covered by FTAs increased from 23% in 2010 to 34% in 2020, whereas the share of world exports covered by NR-PTAs and PFTAs fell by nearly the same amount. Taken together, the share of world trade covered by FTAs and CMs increased from 46% in 2010 to 55% in 2020.
Table 2. World's Exports covered by partners with PTA
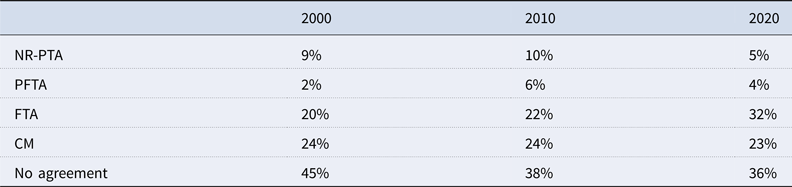
Source: Own elaboration based on UN COMTRADE and NSF-Kellogg Institute.
Increased depth Footnote 14 can also be seen by examining the breadth of PTAs, what Hofmann, Osnago, and Ruta ( Reference Hofmann, Osnago and Ruta 2017) call ‘horizontal depth’. They find that, on average, 11 provisions in reciprocal PTAs and CMs were signed between 1990 and 1994 and 23 provisions in those signed between 2010 and 2015. Adopting their method, we draw on a World Bank dataset containing the number of provisions – among 52 options – included in 318 reciprocal PTAs notified at WTO between 1958 and 2019. Footnote 15 In Table 3, we can see that the average number of provisions in recent trade agreements rose in both core and non-core Footnote 16 groups compared to older agreements. Footnote 17
Table 3. World's Exports covered by partners with PTA
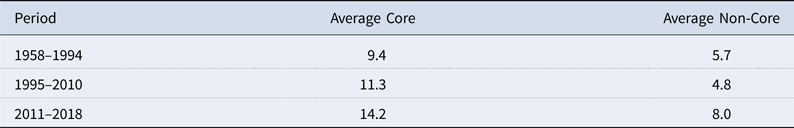
Source: Own elaboration based on UN COMTRADE and NSF-Kellogg Institute.
In addition, Hofmann, Osnago, and Ruta ( Reference Hofmann, Osnago and Ruta 2017), and the database on which they drew, Footnote 18 highlight when provisions were legally enforceable. Nearly all reciprocal PTAs include legally enforceable provisions on tariff liberalization in industrial and agricultural goods. In recent years, however, a much higher share of PTAs contains legally enforceable provisions related to non-tariff measures, such as Sanitary and Phytosanitary Measures (SPS) and Technical Barriers to Trade (TBT). For example, all the SPS and TBT provisions in the five agreements notified to the WTO in 2018 and 2019 are legally enforceable, compared to about one-third of the agreements notified in 2000–2001. As a general rule, agreements between developing countries have fewer and less enforceable provisions than those involving an advanced country.
How will the export coverage of PTAs change when agreements, currently under negotiation or that have been concluded and ratified, come into force? Table 4 provides a list of potential future agreements drawing on various sources. Asia continues to be the motor of trade agreements. The largest of these agreements is RCEP, which accounts for nearly 12% of world exports. As of August 2022, RCEP was already in force in China, Japan, the Republic of Korea, and nine other signatories. Only Indonesia, the Philippines, and Myanmar remain to execute the agreement in full. The EU, despite having already achieved the highest PTA coverage, remains very active, with notable potential agreements, which include EU–India and EU–Mercosur.
Table 4. Exports covered by PTAs, including under GSP, in selected groups
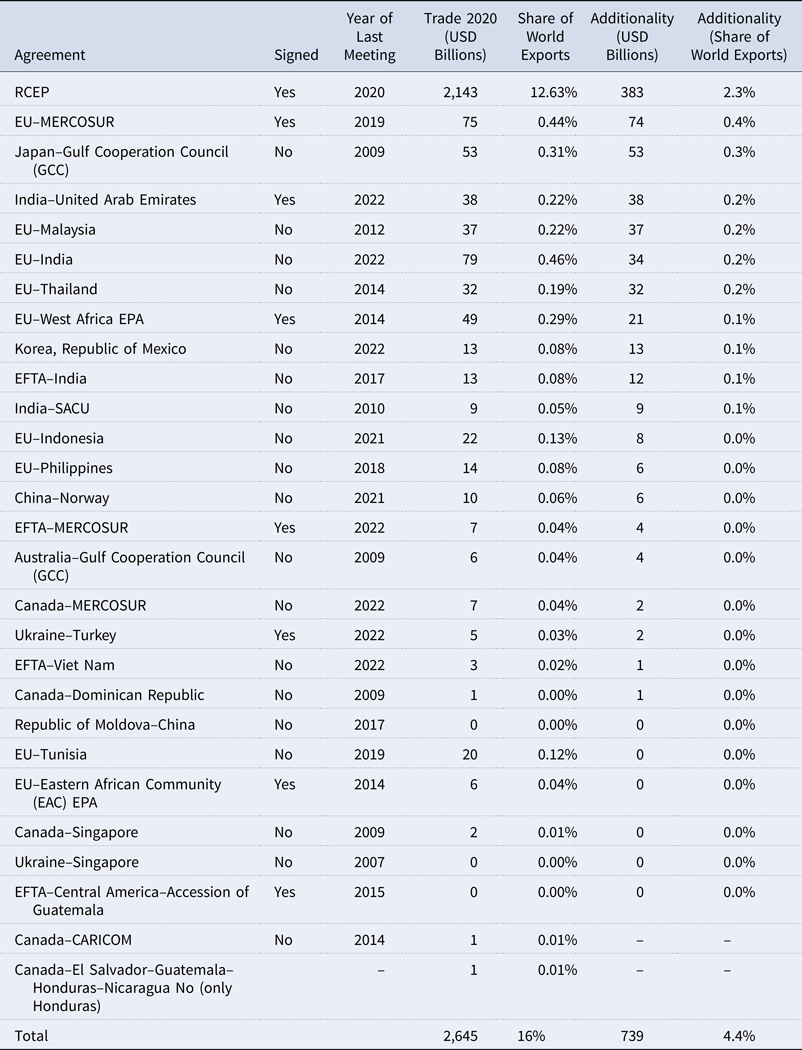
Source: Own elaboration based on WTO and research.
Note: New Zealand–Russia, Ukraine–Serbia, EFTA–Russian Federation–Belarus–Kazakhstan, and EU–US Transatlantic Trade and Investment Partnership (TTIP) were not added due to the low probability of success. We have not included UK Agreements since they do not provide additionality. The US started in July/August 2022 negotiations with Kenya and Taiwan, but it is too early to tell whether these negotiations have a good chance of success.
Total exports affected by these potential agreements account for about 16% of the world total in 2020, and their potential additionality, if all were to come into force, would be 4.4% of world exports. We attach a probability of 1 to RCEP coming fully into force, and, quite arbitrarily, a probability of 0.5 to agreements that were concluded but not ratified, and a probability of 0.25 to agreements that are not concluded but were the object of formal meeting in 2021–2022. Using these parameters, we arrive at 468 billion USD of expected additionality. This would imply an increase in the export coverage of 2.8 percentage points, which would bring the total coverage of PTAs to 66.5% of world trade.
The trade coverage of PTAs is now so extensive that under any assumption about the future of multilateral trade rules, they will play a major role in keeping large parts of world trade secure. In many instances, PTAs now include more parties and have coverage that is both broader (e.g., market access in services, investment) and deeper, i.e., ‘behind the border’ than under the WTO and are increasingly more enforceable. Recent research has shown that ‘deep PTAs’ can benefit third parties, reducing concerns about trade diversion due to tariffs and complex rules of origin.
However, there are no trade deals among the regional hegemons, and the parts of world trade that are most secure are – with some exceptions – predominantly those that are intra-regional. This situation is not entirely new, of course, dating back to the precursors of the EU's single market, the establishment of ASEAN in the late 1960s, and the coming into force of the North American Free Trade Agreement in 1995. However, compared to, say, a decade ago, WTO rules are less secure, and mega-regional agreements in Asia have consolidated.
In this section, we try to discern the systemic implications of these developments against the background of a deepening rift between China and the US and its allies. We argue that based on current trends, interregional trade will become intrinsically more uncertain and unstable than that within the world's main producing regions, causing a partial fragmentation of world trade. Contrary to the views of many politicians and commentators who are comfortable with this course, regional markets will go only so far. In 2021, 70% of North America's exports, 41% of Asia's, and 31% of Europe's were destined outside the region, while Africa and Latin America depend on other regions for 85% of their exports. Footnote 19 Trade links today are global, as they have been as far back as the great explorers of the 15th and 16th centuries, only they run deeper. The globalization of production entails trade in machines, components, and raw materials that are far larger than those in consumer goods. Regionalization is bound to lead to disruption, duplication, and, ultimately, lost efficiency.
Before December 2018, when the CPTPP came into force, there had been no new mega regional agreement since NAFTA a generation prior. In the years since, three other major agreements were concluded: the RCEP among 15 countries in Asia, the US–Mexico–Canada Agreement (USMCA), and the AfCFTA. USMCA is already fully in force. The other agreements are in force in several of their members, and we consider that all will be fully in force in the coming years. The members of these four mega-regional agreements together account for over 60% of the world GDP. If we add the oldest mega-regional agreement to the list, the European Union (EU) after Brexit, countries accounting for over 78% of world GDP are now members of mega-regional agreements.
RCEP, which includes 20 chapters, is notable because it includes China and accounts for about 12% of world trade and 30% of the world GDP. However, since its 15 members, all in Asia were already linked by various PTAs, RCEP's trade coverage additionality is far less, about 2.1%. Most importantly, RCEP connects three manufacturing giants, Footnote 20 China, Japan, and the Republic of Korea for the first time with lower tariffs on about 90% of products and simplified rules of origin, facilitating the progress of regional value chains. The participation of these three nations places RCEP, an agreement that is structured to evolve and deepen (a ‘living agreement’, in the mode of its predecessor, ASEAN), at the center of the world's largest manufacturing hub by far – even without counting access to the resources and markets of other parties to the agreement.
Beyond its economic impact, RCEP has profound political implications. Even though China was not the prime mover of RCEP (ASEAN initiated the agreement), it demonstrates China's commitment to trade liberalization and regional cooperation (Shimizu, Reference Shimizu 2022; Drysdale and Armstrong, Reference Drysdale and Armstrong 2021; Petri and Plumer, Reference Petri and Plummer 2020). India's late decision to drop out of the agreement diminishes its scope but further underscores China's rising political influence and the centrality of its economy in Asia.
CPTPP, the successor to the ill-fated TPP, covers 30 chapters, including innovative provi sions on subsidies and state-owned enterprises. However, unlike the other mega regionals, CPTPP is not confined to one region unless one considers the Pacific as one. Japan, the world's fourth-largest economy, and the other ten members span three continents, Asia, South America, and North America. Because of its geographic scope, diversity, depth, and provisions for the accession of new members to all the PTAs in force, CPTPP is perhaps the most likely to serve as a partial countertrend to the regionalization of world trade. It may also become a testing ground for new disciplines that can become multilateral or that can be copied into other PTAs. In this regard, the agreement's systemic importance as a ‘multilateral mega-regional’ will be enhanced if either the United Kingdom's or China's application to join succeeds.
The USMCA contains 34 chapters and 12 side letters (Villarreal and Fergusson, Reference Villarreal and Fergusson 2020), adding to NAFTA innovative features on electronic commerce, intellectual property protection, state-owned enterprises, and more enforceable labor and environmental standards. However, USMCA provides no significant additional trade liberalization, has more restrictive rules of origin in automobiles than NAFTA, and includes a 16-year sunset clause which introduces uncertainty in investment decisions. The main consequence of USMCA from a systemic perspective is that it precludes the discontinuation of NAFTA, keeping the US tightly connected to its two largest trading partners.
AfCFTA covers all countries in Africa and is the smallest of the new mega regionals terms of trade coverage. Its systemic significance lies in recognizing the importance of trade by the world's poorest nations. Nearly all its members were until recently colonized and have been skeptical of trade liberalization, yet AfCFTA was negotiated autonomously without the significant involvement of Europeans. African nations still trade overwhelmingly outside their region. Still, when interregional trade becomes less secure, it can be seen as a vehicle to boost intraregional trade and as a form of partial insurance. The AfCFTA also holds the promise of improved coordination of positions across the continent in bilateral and multilateral negotiations.
The trade coverage of PTAs varies greatly since nations have followed vastly different paths in negotiating them, especially in recent years. Under President Trump, the US withdrew from the TPP, and the last trade agreement signed by the United States that added coverage to its exports was with the Republic of Korea, signed in June 2007 and entered into force in March 2012, and Colombia, signed in November 2006 and entered into force in May 2012. Including USMCA, about 44% of US exports are now under trade agreements. This contrasts with the members of the EU-27, whose exports are 81% covered by PTAs, of which the EU single market covers 61%. Notable new EU agreements negotiated with third parties since 2010 include those with Canada, Japan, and the United Kingdom, whose exit from the EU represents a step backward in terms of depth. While the EU presently has active negotiations with five partners, Footnote 21 and has concluded but not signed or ratified negotiations with another 23 partners, Footnote 22 the Biden Administration has put all bilateral trade negotiations on indefinite hold and declined to pursue renewal of Trade Promotion Authority which expired in July 2021.
As we can see in Table 5, China was a major beneficiary of GSP but has progressively graduated, so the share of China's exports covered by PTAs has declined, with a sharp fall in 2015 from 68% – GSP accounted for 35% of the total – to 49%, with only 9% accounted for by GSP because the EU withdrew its preferences. However, in recent years, China has been among the most active in negotiating reciprocal trade agreements, many related to its Belt and Road initiative. China's notable FTAs since 2010 include those with Costa Rica in 2010, EFTA in 2013, Switzerland in 2014, Korea and Australia in 2015, Georgia in 2017, and the RCEP. With the coming into force of the RCEP, China's total PTAs export coverage will increase from 49% to 55%. China concluded a Comprehensive Agreement on Investment with the EU, now on hold, and has applied to join the CPTPP. Both these initiatives signal that China is willing to engage in agreements that entail deep reforms on subsidies and state-owned enterprises, among others.
Table 5. Exports covered by all PTAs (Exports covered by NR-PTA or GSP)